|
Swimming threshold prototype (
) -- Developed by Benjamen Wetherill
|
||||||||||||||||
|
The following predicted concentrations of Fecal Indicator Bacteria (FIB) are based on modeled correlations between FIB and weather or water conditions. The data used is sourced from the CESN weather station on Healey Library, and from the NOAA Boston tide gauge. Currently the predictions are only based on one year of historical statistics. An ideal model would include 2-3 years of history. New models will be developed in future years as more data is collected. Click here for a full description of this bacteria forecasting project. The following predictions are for test purposes only! They have not been approved by MA DCR.
The forecasted Enterococcus concentration is calculated using a regression model based on five variables: maximum tidal range, tide phase (ebb/flood), light level (light/dark), air temperature, rain, wind speed, and magnitude of wind toward beach. See the bottom of the page for the actual formulas. The EPA defined threshold for swimming at saltwater beaches is 104 cfu/100mL. If the forecasted concentration is above 104 cfu/100mL, or the probability of exceeding the threshold is greater than 30%, then the beach is considered unsafe for swimming on that day. See the bottom of the page for an analysis of modelled predictions vs. actual bacteria counts. Model formulas: Linear model ln(Ent) = 3.0 - 0.55*TdPhs - 0.71*LtPhs + 0.24*TideD1 + 0.078*ln(RainD1+0.0001) + 0.12*TideD1*WmagD1 Logistic model ln(p/(1-p)) = 3.96 - 2.6*TdPhs + 0.21*ln(RainD3+0.0001) - 0.4*WindD1 + 0.22*TideD1*WmagD1 p = probability of exceeding safety threshold ; TdPhs = tide phase (flood-1 / ebb-0); LtPhs = light phase (light-1 / dark-0) TideD1 = previous 24hr tidal range; RainD1 = previous 24hr total rain WmagD1 = previous 24hr avg wind magnitude toward beach; RainD3 = previous 72hr total rain WindD1 = previous 24hr avg wind speed Model vs. Actuals (2013) 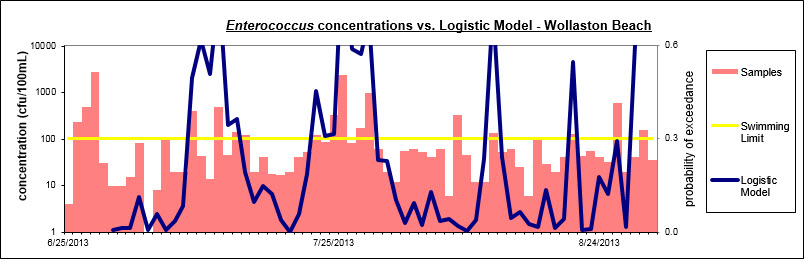 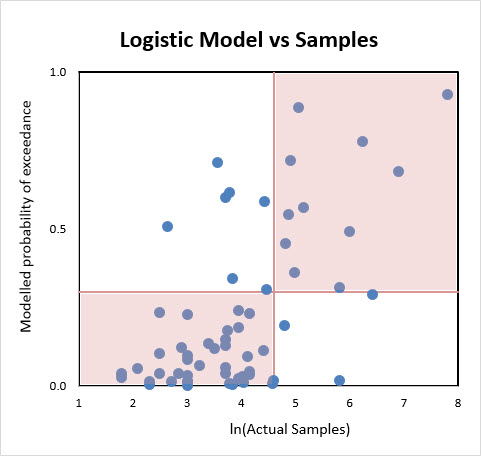 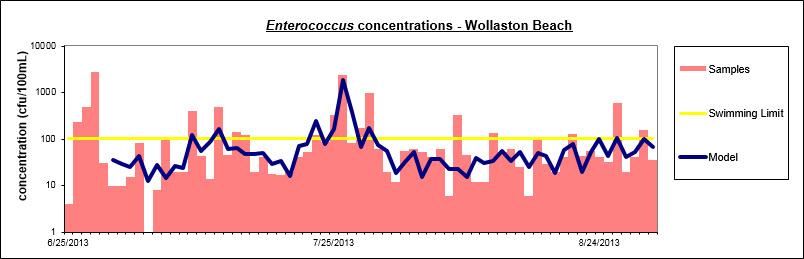 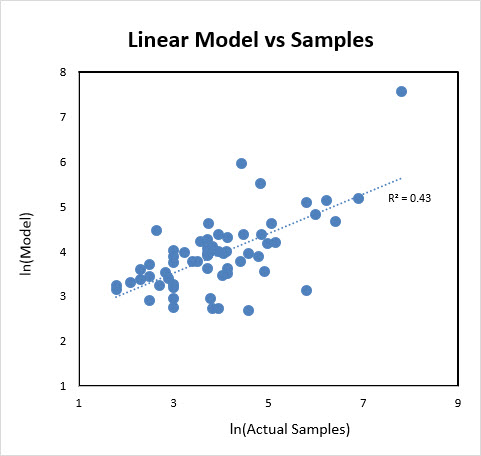 |
||||||||||||||||
|
|
||||||||||||||||