|
Charles River Water Quality Model - Boating Prototype
|
|||||||||||||||||||||||||||||||||||||||||||||||||||||||||||||||
|
A wireless data logger with meteorologic and hydrologic sensing capabilities was installed on the Charles River near Community Boating. The data from this station, combined with flow data from the USGS Waltham river flow gauge, is used to model Fecal Indicator Bacteria (FIB) concentrations in the water. The following predicted FIB concentrations are based on this model and are updated hourly to show real-time water conditions. Flag colors are based on safety thresholds for boating. This page is a prototype for the automation of the Charles River Watershed Association's water quality notification program. Click here for a full description of this bacteria forecasting project. Project team: Ben Wetherill (Marine Science Master's Degree Candidate, UMass Boston), Julie Wood (Environmental Scientist, CRWA), Francesco Peri (Research Associate, UMass Boston). For more information, visit ACASAK Technologies.
Model formulas:
Upper Section logistic model ln(p/(1-p)) = 1.72 + 4.53*ln(RainD2+0.0001) + 0.127*WtmpD1 p = probability of exceeding safety threshold; RainD2 = Previous 48hr total rainfall; WtmpD1 = previous 24hr average water temp Lower Section logistic model ln(p/(1-p)) = -3.18 + 3.94*RainD2 - 1.62*RainD7 + 1.28*log(FlowD1) - 0.34*WindD1 - 0.21*WtmpD1 p = probability of exceeding safety threshold; RainD2 = Previous 48hr total rainfall; RainD7 = previous 7-day total rainfall FlowD1 = Previous 24hr average riverflow; WindD1 = previous 24hr average windspeed WtmpD1 = previous 24hr average water temp Data Logger Photos: 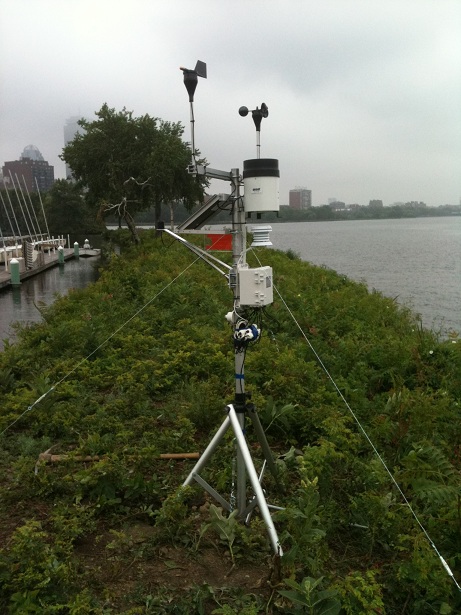 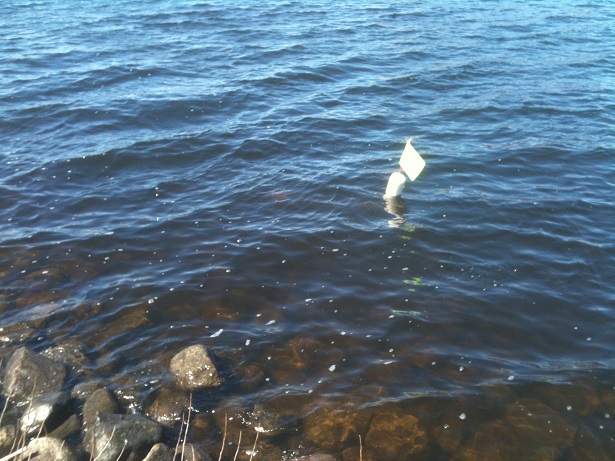 |
|||||||||||||||||||||||||||||||||||||||||||||||||||||||||||||||
|
|
|||||||||||||||||||||||||||||||||||||||||||||||||||||||||||||||